The following is a list of suggestions and questions to review for Exam II.
- Know how to find the mean and median from a list of numbers.
- What are measures for the 'center' of a distribution?
- What are measures for the 'variability' of a distribution?
- Give a stemplot of three hypothetical datasets (you
can make up the numbers) consisting of 10 datapoints with each having one
of the following characteristics: skew left, symmetric, and skew right.
- Know how to construct a stemplot and be able to identify potential
outliers using it.
- Be able to calculate percentiles of a Normal distribution using
standardized scores and Table 8.1.
- Approximately what proportion of measurements from a bell shaped
distribution are within 1 standard deviation of the mean? 2 standard
deviations? 3 standard deviations?
- Understand the role of natural variability in statistical
relationships.
- Know what statistical significance means (and keep in mind the
warnings about it).
- Correlation (pictures are helpful ways to illustrate ideas)
- What does it measure?
- How is it affected by outliers?
- What does strong correlation look like graphically?
- What numerical values of the correlation coefficient indicate
strong correlation?
- What does weak correlation look like graphically?
- What numerical values of the correlation coefficient indicate
weak correlation?
- How are positive and negative correlation different?
- Give numerical and graphical examples that indicate/show
positive and negative correlation.
- Understand how correlation (or lack thereof) can be misleading.
- Does correlation imply causation?
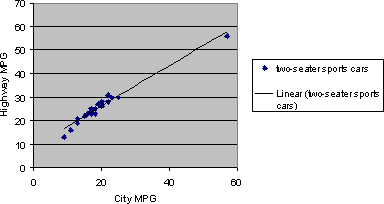
- Use the scatterplot when answering the two questions that follow.

Suppose the relationship between fuel
efficiency on the highway and fuel efficiency in the city for
two-seater sports cars can be modeled using the following regression
equation:
y= 9.14 + 0.856 x where y is fuel efficiency on the
highway and x is fuel efficiency in the city.
- If your two-seater sports car gets 28 miles per gallon in the
city, what is the predicted mileage for the highway?
- What is the predicted highway mileage for 0 mpg in the city?
Why does this result not make sense and why is it inadvisable to
make a prediction for 0 mpg in the city given our data?
- For each of the following pairs of variables, give one or two
reasons why they may be related and explain your choice(s):
- In Sitka: Daily sales of artwork and daily high temperature
- Cell phone sales and internet usage
- Number of students and number of meals prepared in the cafeteria
- age and income
- average annual rainfall and #of wildfires per year
- Amount of money gained via fundraising by a political candidate and
the percentage of the vote that goes the the same candidate.
- Understand why it may be important to use rates instead of raw
counts when comparing data from different populations.
- If you have a relative risk of 1.5 of cancer due to family history,
what is your increased risk? If you have an increased risk of 30% for
a certain disease, what is your relative risk?
- How can statistics about risk be misleading?
- Recall that there are two interpretations of probability:
relative frequency and personal probability. Which interpretation
applies to this statement: "The probability that I will pass this
exam is 75%"? Explain.
- Explain which of the following more closely describes
what it means to say that the probability of a tossed coin
landing with heads up is 1/2:
Explanation 1: After more and more tosses, the
fraction of heads will get closer and closer to 1/2.
Explanation 2:The number of heads will always
be about half the number of tosses.
- Give one example of how each of the following concepts has had or
might have unwanted effect on a decision or action in your daily life:
(if necessary refer to Chapter 16 for explanation of terms)
- Conservatism
- Optimism
- Forgotten base rates
- Availability
- Suppose you play the roulette wheel on your next trip to Vegas.
If you place your bet on red three times in a row and lose each time
with the winner being black.
Which of the following scenarios best describes your situation?
- You should place your next bet on red because it is very
unlikely for red to lose four times in a row.
- You should place your next bet on black because clearly there
is something going on with the wheel.
- It does not matter whether you stay with red or go with black.
- Suppose you go to your doctor for a routine examination,
without any complaints of problems. A blood test reveals
that you have tested positive for a certain deadly disease.
What should you ask your doctor in order to assess how worried
you should be?
- Suppose two sisters are reunited after not seeing each
other since they were 3 years old. They are amazed to find
out that they are both married to men named James and that
they each have a daughter named Jennifer. Explain why this
is not so amazing.
