- 6.1 The interior elements of the table are rounded to the
nearest 1000, so if the overall total is based upon unrounded figures,
there may be some disagreement.
- 6.2
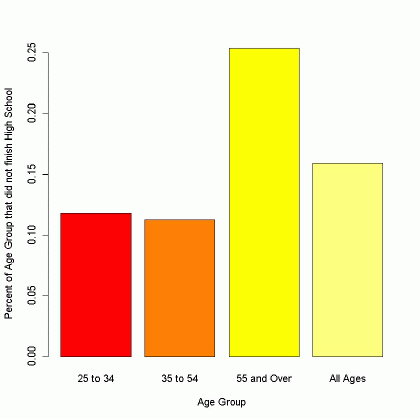
Education 25 and Older HS Not Completed 15.9% Completed HS 33.1% College, 1 to 3 years 25.4% College, >4 years 25.6% - 6.4

It appears that people of ages 55 and over failed to complete high school at a much higher rate than those of other age classes.- 6.7
- 6.2
- a)
Major Female Accounting 30.2% Administration 40.4% Economics 2.2% Finance 27.1% Major Male Accounting 34.8% Administration 24.8% Economics 3.7% Finance 36.6% - b) 386/722 responded, so the 46.5% did not respond.
- 6.8 One set is a=25, b=25, c=35, d=15. Another set is
a=30, b=20, c=30, d=20.
- 6.9
- a)>13% of all Alaska Airlines flights were delayed. 10% of all America West flights
were delayed.
- b)>
City Alaska Airline
Percent DelayedAmerica West
Percent DelayedLos Angeles 11% 14% Phoenix 5% 8% San Diego 9% 15% San Francisco 17% 29% Seattle 14% 23% - c) Notice that the America West flies has more flights in Phoenix than any other city by far, while Alaska Airlines has more flights in Seattle. Phoenix has the lowest rate of delays, so America West's overall rate of delay is influenced heavily by the large number of flights in Phoenix. Seattle has one of the highest rates of delay, so the overall rate for Alaska Airlines is relatively high due to the number of flights it makes into Seattle.
- b)>
- 6.11
Marginal Distribution of Marital Status Single 4.1% Married 93.9% Divorced 1.5% Widowed .5%
Each of the marginal distributions sum up to exactly 100%. Depending on how one rounds the percentages, it is possible that the results will not be exactly 100%.Marginal Distribution of Job Grade Job Grade 1 11.6% Job Grade 2 51.5% Job Grade 3 30.2% Job Grade 4 6.7% - 6.12 17% of single men hold Grade 1 jobs. 6.1% of Grade 1 jobs are held by single men.
- 6.13
Percents should add up to 100% (up to round off error).Conditional Distribution of Job Grade among Single Men Job Grade 1 17.2% Job Grade 2 65.9% Job Grade 3 14.8% Job Grade 4 2.1% - 6.14
- 6.12 17% of single men hold Grade 1 jobs. 6.1% of Grade 1 jobs are held by single men.
- a) The counts of married and signle men with Grade 1 jobs do not describe the
relationship between marital status and job grade because it does not account for the fact
that the vast majority of workers are married.
- b)
The table suggested that single men tend to be more likely to have Grade 1 jobs than most others and much less likely to have Grade 4 jobs.Percent of men in each marital status group with given job grade Job Grade Single Married Divorced Widowed 1 17.2% 11.3% 11.9% 19% 4 2% 6.9% 5.6% 9.5% - b)
- 6.15 Age is a lurking variable that may influence marital status and job grade.
Older men are more likely to be married and more likely to have a higher level job.
- 6.21 The data suggests there may be a link between quickness to anger and heart disease. Of the people who scored low on the anger test, 1.7% experienced some heart disease, 2.3% of those who had moderate anger scores experienced heart disease, and 4.3% of those with high anger scores experienced heart disease. This is evidence that people who get angry easily tend to have more heart disease (though it does not prove that the anger is the reason for the heart disease).